Check Point Firewalls
Products & Firewall from https://checkpoint.com
- Design
- Operation
- Useful CLI Commands Check Point
- Export/Import Policy Package
- Useful Smartlog Queries
- Useful SNMP OIDs (VSX)
- Threat Prevention API
- GAIA - Easy execute CLI commands on all gateways simultaneously
- Threat Prevention Cyber Attacks Dashboard Template
- DOS & DDOS Prevention, Mitigation
- Export Syslog Messages
- Missing feature - Global search across multiple CMA
- Show logging using the web interface
- Managing partition sizes via LVM manager on Gaia OS
- SmartConsole cli parameters
- Jump to Rule Number or UID
- SmartConsole: Clear disconnected sessions
- Initiating manual cluster failover
- How to migrate Custom Queries from one SmartView Tracker to another
- Check Point Log Export
- Troubleshooting
- After policy install: UDP packet that belongs to an old session drops
- How to copy a file from a Check Point firewall
- CPView Utility and High Load Traffic
- IPS Troubleshooting
- Limitation of 251 Inline Layers
- Packetpushers with SQLNet
- Show interface speed and duplex as a list
- VPN Troubleshooting
- Threat Extraction Troubleshooting
- Links & Tools
Design
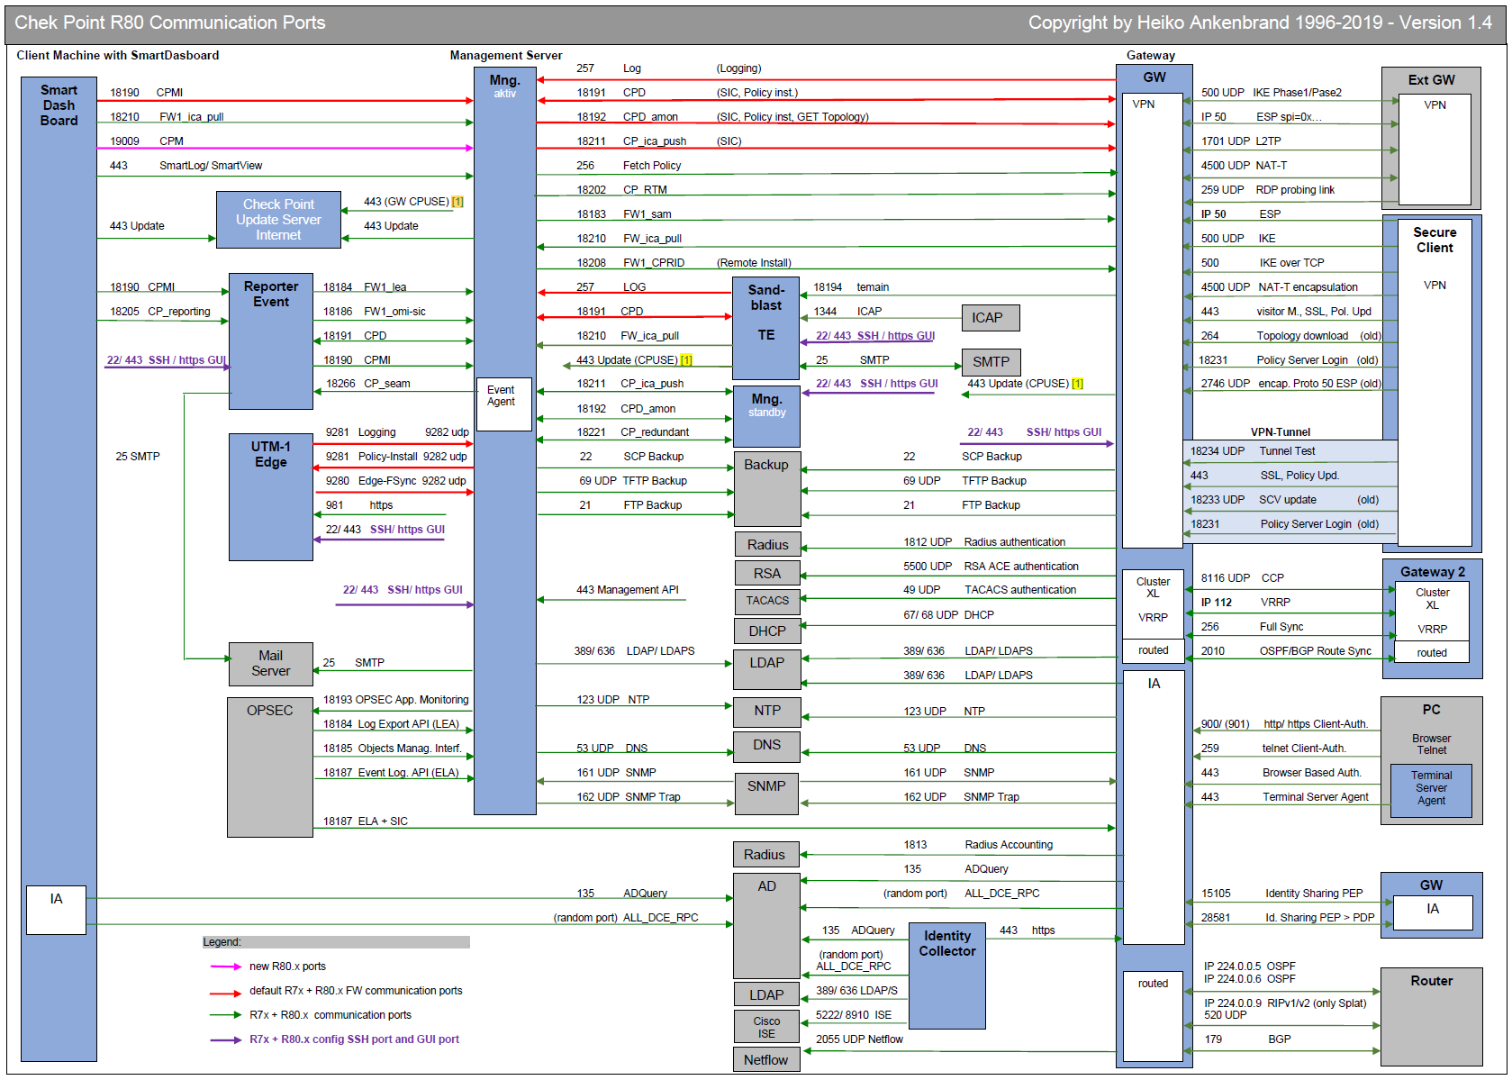
Network Ports used for communication
Introduction
This drawing should give you an overview of the used R80 and R77 ports respectively communication flows. It should give you an overview of how different Check Point modules communicate with each other. Furthermore, services that are used for firewall operation are also considered. These firewall services are also partially mapped as implied rules in the set on the firewall.
Link
Thank you Heiko Ankenbrand for creating such a valuable overview:
Overview
Download
https://www.ankenbrand24.de/wp-content/uploads/2019/12/Ports_1.5a.pdf
Log Files location Check Point
Here are the different Log File locations on a Check Point Appliance:
| Feature | File Location |
|
Alerts |
|
|
Command auditing |
|
|
CPD |
|
|
Distribution |
|
|
Dynamic Routing |
|
|
Expert mode shell auditing |
|
|
FWD |
|
|
FWK |
|
|
Gaia Clish |
|
|
Gaia |
|
|
General |
|
|
SMO |
|
|
Installation |
|
|
Installation - OS |
|
|
Log Servers |
|
|
Policy |
|
|
Reboot logs |
|
|
SGM Configuration Pull Configuration |
|
|
VPND |
|
Operation
Useful CLI Commands Check Point
Cheatsheets
- Check Point CLI Reference Card (https://www.roesen.org/files/cp_cli_ref_card.pdf)
- FW Monitor (https://www.roesen.org/files/fw_monitor.pdf)
- R80 Cheat Sheet FW-Monitor (https://www.ankenbrand24.de/index.php/articles/check-point-articel/cheat-sheets/r80-cheat-sheet-fw-monitor/)
- ClusterXL Cheat Sheet (https://www.ankenbrand24.de/index.php/articles/check-point-articel/cheat-sheets/r80-cheat-sheet-clusterxl/)
CLISH Commands
To start a transaction in CLISH use start transaction.
Commands - commit, or rollback to be used to end the transaction mode. All changes made using commands in transaction mode are applied at once or none of the changes are applied based on the way transaction mode is terminated.
Show Commands
| save config | save the current configuration |
| show commands | shows all commands |
| show allowed-client all | show allowed clients |
| show arp dynamic all | displays the dynamic arp entries |
| show arp proxy all | shows proxy arp |
| show arp static all | displays all the static arp entry |
| show as | displays autonomous system number |
| show assets all | display hardware information |
| show bgp stats | shows bgp statistics |
| show bgp summary | shows summary information about bgp |
| show vrrp stats | show vrrp statistics |
| show bootp stats | shows bootp/dhcp relay statistics |
| show bootp interface | show all bootp/dhcp relay interfaces |
| show bonding groups | show all bonding groups |
| show bridging groups | show all bridging groups |
| show backups | shows a list of local backups |
| show backup status | show the status of a backup or restore operation being performed |
| show backup last-successful | show the latest successful backup |
| show backup logs | show the logs of the recent backups/restores performed |
| show clock | show current clock |
| show configuration | show configuration |
| show-config state | shows the state of configuration either saved or unsaved |
| show date | shows date |
| show dns primary | shows primary dns server |
| show dns secondary | shows secondary dns server |
| show extended commands | shows all extended commands |
| show groups | shows all user groups |
| show hostname | show host name |
| show inactivity-timeout | shows inactivity-timeout settings |
| show interfaces | shows all interfaces |
| show interfaces ethx | shows settings related to an interface “x |
| show interfaces | show detailed information about all interfaces |
| show ipv6-state | shows ipv6 status as enabled or disabled |
| show management interface | shows management interface configuration |
| show ntp active | shows ntp status as enabled or disabled |
| show ntp servers | shows ntp servers |
| show ospf database | shows ospf database information |
| show ospf neighbors | shows ospf neighbors information |
| show ospf summary | shows ospf summary information |
| show pbr rules | shows policy based routing rules |
| show pbr summary | shows policy based routing summary information |
| show pbr tables | show pbr tables |
| show route | shows routing table |
| show routed version | shows information about routed version |
| show snapshots | shows a list of local snapshots |
| show snmp agent-version | shows whether the version is v1/v2/v3 |
| show snmp interfaces | shows snmp agent interface |
| show snmp traps receivers | shows snmp trap receivers |
| show time | shows local machine time |
| show timezone | show configured timezone |
| show uptime | show system uptime |
| show users | show configured users and their homedir, uid/gid and shell |
| show user <username> | shows settings related to a particular user |
| show version all | shows version related to os edition, kernel version, product version etc |
| show virtual-system all | show virtual-systems configured |
| show vpn tunnels | use to show the vpn tunnels |
| show vrrp stats | shows vrrp status |
| show vrrp interfaces | shows vrrp enabled interfaces |
Set Commands
| add allowed-client host any-host / add allowed-client host <ip address> | add any host to the allowed clients list/ add allowed client by ipv4 address |
| add backup local | create and store a backup file in /var/cpbackups/backups/( on open servers) or /var/log/cpbackup/backups/ ( on checkpoint appliances) |
| add backup scp ip value path value username value |
adds backup to scp server |
| add backup tftp ip value [ interactive ] | adds backup to tftp server |
| add snapshot | create snapshots which backs up everything like os configuration, checkpoint configuration, versions, patch level), including the drivers |
| add syslog log-remote-address <ip address> level <emerg/alert/crit/err/warning/notice/info/debug/all> | specifies syslog parameters |
| add user <username> uid <user-id-value> homedir | creates a user |
| expert | executes system shell |
| halt | put system to halt |
| history | shows command history |
| lock database override | overrides the config-lock settings |
| quit | exits out of a shell |
| reboot | reboots a system |
| restore backup local [value] | restores local backup interactively |
| rollback | ends the transaction mode by reverting the changes made during transaction |
| save config | save the current configuration |
| set backup restore local <filename> | restores a local backup |
| set cluster member admin {down | up} | initiating manual cluster failover |
| set core-dump <enable/disable> | enable/disable core dumps |
| set date yyyy-mm-dd | sets system date |
| set dhcp server enable | enable dhcp server |
| set dns primary <x.x.x.x> | sets primary dns ip address |
| set dns secondary <x.x.x.x> | sets secondary dns ip address |
| set expert-password | set or change password for entering into expert mode |
| set edition default <value> | set the default edition to 32-bit or 64-bit |
| set hostname <value> | sets system hostname |
| set inactivity-timeout <value> | sets the inactivity timeout |
| set interface ethx ipv4-address x.x.x.x mask-length 24 | adds ip address to an interface |
| set ipv6-state on/off | sets ipv6 status as on or off |
| set kernel-routes on/off | sets kernel routes to on/off state |
| set management interface <interface name> | sets an interface as management interface |
| set message motd value | sets message of the day |
| set ntp active on/off | activates ntp on/off |
| set ntp server primary x.x.x.x version <1/2/3/4> | sets primary ntp server |
| set ntp server secondary x.x.x.x version <1/2/3/4> | sets secondary ntp server |
| set snapshot revert<filename> | revert the machine to the selected snapshot |
| set snmp agent on/off | sets the snmp agent daemon on/off |
| set snmp agent-version <value> | sets snmp agent version |
| set snmp community <value> read-only | sets snmp readonly community string |
| add snmp interface <interface name> | sets snmp agent interface |
| set snmp traps receiver <ip address> version v1 community value | specifies trap receiver |
| set snmp traps trap <value> | set snmp traps |
|
set static-route x.x.x.x/xx nexthop gateway address x.x.x.x on set static-route x.x.x.x/xx comment "{comment}" |
adds specific static route comment static route |
|
set static-route NETWORK_ADDRESS/MASK_LENGTH nexthop gateway address GATEWAY_IP_ADDRESS off set static-route <Destination IP address> off set static-route default nexthop gateway address GATEWAY_IP_ADDRESS off |
Delete Routes |
| set time <value> | sets system time |
| set time zone <time-zone> | sets the time zone |
| set vsx off | sets vsx mode on |
| set vsx on | sets vsx mode off |
| set user <username> password | sets users password |
| set web session-timeout <value> | sets web configuration session time-out in minutes |
| set web ssl-port <value> | sets the web ssl-port for the system |
Generic Commands
The commands below have to be used in expert mode and NOT in clish.
| Action | Use on | Command |
|---|---|---|
| SIC Reset | GW / MGMT |
On MGMT goto GW settings - General Properties - Communication More information: How to reset SIC on a VSX Gateway for a specific Virtual System |
| Show licenses | MGMT / GW | cplic print -x (-x print signatures) |
| Remove Evaluation License | GW |
cplic eval_disable You have disabled Check Point evaluation period |
| Get licenses from management system on gateway | GW | contract_util mgmt |
|
Show enabled blades Example: # enabled_blades
fw ips ThreatEmulation Scrub |
GW | enabled_blades |
| ClusterXL Switch over (disable ClusterXL state) | GW |
clusterXL_admin down Note: The [-p] is an optional flag (stands for "permanent") - the Critical Device called "admin_down" will be automatically added to the $FWDIR/conf/cphaprob.conf file, so that this configuration survives the reboot. |
| Show Cluster status | GW | cphaprob stat |
| Show Virtual Cluster Interfaces | GW | cphaprob -a if |
| Debug to see all dropped connections | GW |
fw ctl zdebug drop fw ctl zdebug -h (help) |
| Debug to see all NAT informations | GW | fw ctl zdebug + xlat |
| Debug to get a fast packet trace | GW | fw ctl zdebug + packet | grep -B 1 TCP |grep -B 1 "(SYN)" |
| See stats of number of connections | GW | cpstat fw |
| Connections load on the fw | GW | fw tab -s -t connections |
| Clear ALL connections on fw from the table (CAUTION!) | GW | fw tab -t connections -x |
|
ClusterXL sync statistics to R80.10 (sk34476) ClusterXL sync statistics for R80.20 and higher (sk34475) |
GW GW |
fw ctl pstat CLISH: show cluster statistics sync |
| Show connected SmartConsole clients | MGMT | cpstat mg |
|
Manage the GUI clients that can use SmartConsoles to connect to the Security Management Server |
MGMT |
cp_conf client get # Get the GUI clients list cp_conf client add <GUI client> # Add one GUI Client cp_conf client del < GUI client 1> < GUI client 2>... # Delete GUI Clients cp_conf client createlist < GUI client 1> < GUI client 2>... # Create new list. |
| Show sync details | GW | fw ha -f all |
| Shows packets accepted, dropped, peak connections, and top rule hits | GW | cpstat blades |
| Use CLI commands over SIC from MGMT without password, used as example for "last chance" configs. | MGMT |
cprid_util (--help)
|
| Show interfaces, ip-addresses and subnet mask, used for a very good interface-overview. | MGMT/GW | fw getifs |
| Show installed hotfixes and releases | GW | cpinfo -y all |
|
Create cpinfo file for sending to the support. |
MGMT / GW | cpinfo -Ddlzk -o /var/tmp/$HOSTNAME |
| Show statistics about accelerated traffic | GW |
fwaccel stats -s |
| This command will list what interface is connected to what IRQ to what core. | GW |
fw ctl affinity -l -v -r fw ctl affinity -s will subsequently allow you to set the values. |
|
**UNDOCUMENTED** Show state and timeline of ClusterXL events in CLISH |
GW | CLISH: show routed cluster-state detailed |
|
Top 10 Source-IPs in connection table. You need to manual convert hex in ascii to get the ip, like so: 0a1f0af2 For the top 10 destinations, substitute $4 for $2 in the awk command. |
GW | fw tab -u -t connections | awk '{ print $2 }' | sort -n | uniq -c | sort -nr | head -10 |
|
Log Diagnostic Report It will also produce a detailed output at /tmp/sme-diag/results/detailed_diag_report.txt |
LOG | $RTDIR/scripts/doctor_log.sh |
VPN Commands
The commands below have to be used in expert mode and NOT in clish.
To view informations about VPN Tunnels
In R80+:
- Open SmartConsole > Logs & Monitor.
- Open the catalog (new tab).
- Click Tunnel & User Monitoring.
See also: Logging and Monitoring R80.10 (Part of Check Point Infinity)
| Action | Use on | Command |
|---|---|---|
| VPN statistics | GW | cpstat -f all vpn |
| VPN Tunnel manipulation | GW |
vpn tu Interactive usage (better): vpn shell |
| VPN Remote Access specific | GW | pep show user all |
|
Check VPN-1 major and minor version as well as build number and latest hotfix. |
GW | vpn ver [-k] |
| Show, if any, overlapping VPN domains | GW | vpn overlap_encdom |
| VPN IKE Debugging (P1 and P2 Communication) The resulting $FWDIR/log/ike.elg and/or $FWDIR/log/ikev2.xml can be used in the "IKEView" Utility from Check Point, see here: sk30994 |
GW |
vpn debug ikeon (enable IKE debug) vpn debug ikeoff (disable IKE debug) |
VSX specific
The commands below have to be used in expert mode and NOT in clish
| Action | Use on | Command |
|---|---|---|
|
Show VSX status. |
VSX / VS | vsx stat [-v] [-l] [id] |
|
Show connections stats |
VSX | vsx stat -v -l |
| View current shell context. | VSX | vsenv |
| Set context to VS ID <id> | VSX | vsenv <id> |
| Reset SIC for VS | VSX | vsenv <id>; fw vsx sicreset |
| View state tables for virtual system <id>. | VSX | vsenv <id>; fw tab -t <table> |
| View traffic for virtual system with ID <id>. Attention: with fw monitor use -v instead of -vs. |
VSX | fw monitor -v <id> -e 'accept;' |
| View HA state of all configured Virtual Systems. | VSX | cphaprob state |
| View HA state for Virtual System ID <id>. | VSX | cphaprob -vs <id> state |
| Show all bond interfaces and Cluster state | VSX | cphaprob show_bond -a |
| Check VS bit state | VSX | vs_bits -stat All VSs are at 64 bits (R80.20 default, R80.10 need upgrade) |
| Show virtual devices memory usage | VSX | cpstat -f memory vsx |
|
Traffic statistic per virtual system See sk90860 More information: Check Point Useful SNMP OIDs (VSX) |
VSX |
snmpwalk -v 2c -c community 127.0.0.1 .1.3.6.1.4.1.2620.1.16.22.3 (vsxStatusMemoryUsage) SNMPv2-SMI::enterprises.2620.1.16.22.3.1.1.1.0 = INTEGER: 0 |
| To enable monitoring CPU per-VS with OID .1.3.6.1.4.1.2620.1.16.22.4 | VSX | fw vsx resctrl monitor enable |
|
To enable monitoring memory per-VS with OID .1.3.6.1.4.1.2620.1.16.22.3 Needs a reboot! |
VSX | vsx mstat enable |
API specific (mgmt_cli)
API Manual: https://sc1.checkpoint.com/documents/latest/APIs/index.html
The mgmt_cli tool is installed as part of Gaia on all R80 gateways and can be used in scripts running in expert mode.
The mgmt_cli.exe tool is installed as part of the R80 SmartConsole installation (typically under C:\Program Files (x86)\CheckPoint\SmartConsole\R80\PROGRAM\) and can be copied to run on any Windows machine.
On Windows you cannot login with a certificate since the mgmt_cli_login is missing, you need to login with user/password or use the mgmt_cli tool on the management server.
To use the actual ssh login with mgmt_cli use the undocumented featuremgmt_cli -r true
If your mgmt server is running on another port (ex. 8443) usemgmt_cli --port 8443
Show api-settings
Check if clients are allowed to connect to the api and check all the api-settings.
mgmt_cli -r true --domain 'System Data' show api-settings


...
accepted-api-calls-from: "all ip addresses"
...
API Status
To confirm that the API is usable and available remotely, run the api status command. If Accessibility shows “Require all granted” it means that any system can access the API (on R80 this will show “Allow all”).
[Expert@awsmgmt:0]# api status

API Settings:
---------------------
Accessibility:                      Require all granted
Automatic Start:                    Enabled

Processes:

Name      State     PID       More Information
-------------------------------------------------
API       Started   14472
CPM       Started   14350     Check Point Security Management Server is running and ready
FWM       Started   13807

Port Details:
-------------------
JETTY Internal Port:      50276
APACHE Gaia Port:         443


--------------------------------------------
Overall API Status: Started
--------------------------------------------

API readiness test SUCCESSFUL. The server is up and ready to receive connections

Notes:
------------
To collect troubleshooting data, please run 'api status -s <comment>'
API Status Troubleshooting data
To create a <comment>.tgz file with troubleshooting data start
api status -s <comment>API restart
To restart the api process use the following
api restart
2024-Jun-21 11:59:04 - Stopping API ...
2024-Jun-21 11:59:06 - API stopped successfully.
2024-Jun-21 11:59:06 - Starting API ...
2024-Jun-21 11:59:08 - API started successfully.
logging in
First create a session into a file and reuse it:
mgmt_cli login user admin > id.txtWith read-only access:
mgmt_cli login user admin read-only true > id.txtSearch object in database
search objects by IP, return all objects that contain the ip explicitly or within a nework address space/range.
mgmt_cli -s id.txt show objects filter "192.168.1.1" ip-only true --format json | jq '.objects[] | {name: .name, subnet: .subnet4, mask: ."mask-length4"}'Show Hosts
mgmt_cli -s id.txt show hosts --format jsonShow access layers
mgmt_cli show access-layers limit 500 -s id.txt --format json | jq '."access-layers"[].name'Output:
"Layer1"
"Layer2"
...
Show number of rules in policy
mgmt_cli show access-rulebase name "<layer>" -s id.txt --format json limit 1 | jq '.total'Show access rule base
mgmt_cli show access-rulebase offset 0 limit 20 name "Network" details-level "standard" use-object-dictionary true show-hits true hits-settings.from-date "2020-01-01" hits-settings.to-date "2020-12-31T23:59" hits-settings.target "corporate-gw" --format jsonDisplay rule with explicit uid
mgmt_cli -s id.txt show access-rule layer "My_policy Network" uid "xxxxxxxx-xxxx-xxxx-xxxx-xxxxxxxxxxx"Show unused objects in objects-db
mgmt_cli show unused-objects offset 0 limit 50 details-level "standard" -s id.txt --format jsonShow changes from who and when in objects-db
mgmt_cli show changes from-date "2019-04-11T08:20:50" to-date "2019-04-15" -s id.txt --format jsonRun script on firewall
https://sc1.checkpoint.com/documents/latest/APIs/index.html#web/run-script~v1.6%20
mgmt_cli run-script script-name "ifconfig" script "ifconfig" targets.1 "corporate-gateway" -s id.txt --format jsonShow application-site URLs
mgmt_cli show application-site name "HTTPS Pass Through Global" details-level "standard" -s id.txt --version 1.2 --format jsonShow VPN communities
mgmt_cli -r true show vpn-communities-star details-level full -s id.txt --format jsonmgmt_cli -r true show vpn-communities-meshed details-level full -s id.txt --format jsonCount and show access-layers (Inline Layers)
mgmt_cli show access-layers limit 500 --format jsonOutput:
.
.
 } ],
 "from" : 1,
 "to" : 260,
 "total" : 260
}
Links
http://sicuriconnoi.blogspot.com/2017/11/top-checkpoint-cli-commands.html
Check Point stattest Utility for OID Troubleshooting on GW
https://sc1.checkpoint.com/documents/R80.40/WebAdminGuides/EN/CP_R80.40_CLI_ReferenceGuide/Content/Topics-CLIG/FWG/stattest.htm
Export/Import Policy Package
Check Point ExportImportPolicyPackage tool enables you to export a policy package from a Management database to a .tar.gz file, which can then be imported into any other Management database. The tool is supported for version R80.10 and above.
This tool can be used for backups, database transfers, testing, and more.
Link: https://github.com/CheckPointSW/ExportImportPolicyPackage
Useful Smartlog Queries
Generic Queries
| Research | SmartLog Query |
|---|---|
| Search for E-Mail Subject Note: Search without quotation marks and wildcard works for email_subject |
email_subject:*TEXT* |
| Application Control Proxy Log | blade:"Application Control" AND appi_name:"Web Surfen" AND *part-of-hostname* |
| Every logs of a specific rule | {ABC12345-ABC1-ABC1-ABC1-ABC123ABC12} |
| Security Management Log Server : when logs were not able to be sent to it | "were not sent to log server" |
| Filter Logs by Geo-Location | src_country:"Germany" AND src:<ip-address> |
| Alert on GW | type:Alert AND origin:<fw-gwname> |
| FW Control Messages (Failover etc.) | type:Control |
| ClusterXL Control Messages, Cluster Switch over Messages | type:Control ClusterXL |
| DHCP Messages | service:dhcp |
| Address Spoofing | address spoofing |
| Find aggressive aging events | aggressive aging |
| Any TCP state errors listed in sk101221 |
tcp (fin OR syn) NOT "both fin" NOT "established" In the query field, type "tcp state" (without quotes) or any relevant text (e.g., "syn_sent", "both fin") |
| Global Broadcast | dst:255.255.255.255 |
| HTTPS Inspection CRL or OCSP errors | blade:"HTTPS Inspection" crl OR ocsp |
| Certificates: any alert regarding crl (Certification Revocation List) or certificates (see sk104400for more details) | type:alert (certificate or CRL) |
| Potential network configuration problem messages in log - See SK63160 |
"Engine Settings - TCP" |
| IPS Bypass Messages See discussion here: Checkmates: IPS bypass |
blade:IPS NOT( action: (prevent OR block) ) OR "IPS Bypass Engaged" OR "IPS Bypass Disengaged" |
Threat Extraction / Emulation
| Research | SmartLog Query |
|---|---|
| Threat Extraction | blade:"Threat Extraction" AND action:Extract |
| Threat Extraction Search for E-Mail Subject | blade:"Threat Extraction" OR blade:"Threat Emulation" AND email_subject:" TTTTT" OR email_subject:"TTTTT" |
| Threat Extraction show last activity | blade:"Threat Extraction" AND "Content Removal" OR "Conversion to PDF" |
| Threat Emulation show errors | blade:"Threat Emulation" *"ended with verdict Error"* |
| Threat Emulation show found threats | blade:"Threat Emulation" AND severity:Critical NOT type:Correlated |
Endpoint Security & Remote Access
| Research | SmartLog Query |
|---|---|
| Seeing tunnels activities | tunnel_test or action:"Key Install" or action:"Failed Log In" OR action:"Log In" OR action:"Log Out" OR action:reject OR action:Update |
| Connection Errors | blade:vpn AND action:Reject ( "endpoint" OR "user" OR "Office Mode" ) |
| Errors Authenticating Users | "Could not obtain user object" "IKE failure" |
Useful SNMP OIDs (VSX)
Check Point and SNMP
Monitoring for a Firewall is important, you need to make sure that you see the baseline of your environment and that you can see when some value will go up too high.
The following guide is showing some of the most used SNMP OID for monitoring generic HW Appliances and VSX Clusters.
To Browse the Check Point MIBS use: https://mibs.observium.org/mib/CHECKPOINT-MIB/ or http://oidref.com/1.3.6.1.4.1.2620
Activate SNMP
To enable SNMP on a Check Point FW checkout the sk90860
Check Point MIB Files
MIB Files can be found in sk90470
SNMP OIDs
OIDs: Hardware Status
Hardware sensors (fans, power supplies, temperatures and raid state)
| Fan status | fanSpeedSensorStatus | .1.3.6.1.4.1.2620.1.6.7.8.2.1.6 |
| Power Supply status | powerSupplyStatus | .1.3.6.1.4.1.2620.1.6.7.9.1.1.2 |
| Raid status | raidDiskState | .1.3.6.1.4.1.2620.1.6.7.7.2.1.9 |
| Temperature status | tempertureSensorTable | .1.3.6.1.4.1.2620.1.6.7.8.1 |
CHECKPOINT-MIB::fanSpeedSensorStatus.1.0 = INTEGER: 0
CHECKPOINT-MIB::fanSpeedSensorStatus.2.0 = INTEGER: 0
CHECKPOINT-MIB::fanSpeedSensorStatus.3.0 = INTEGER: 0
CHECKPOINT-MIB::fanSpeedSensorStatus.4.0 = INTEGER: 0
snmpwalk -v 3 -l authNoPriv -u user -A pass vsx1 CHECKPOINT-MIB::powerSupplyStatus
CHECKPOINT-MIB::powerSupplyStatus.1.0 = STRING: Up
CHECKPOINT-MIB::powerSupplyStatus.2.0 = STRING: Up
snmpwalk -v 3 -l authNoPriv -u user -A pass vsx1 CHECKPOINT-MIB::tempertureSensorTable
CHECKPOINT-MIB::tempertureSensorIndex.1.0 = INTEGER: 1
CHECKPOINT-MIB::tempertureSensorIndex.2.0 = INTEGER: 2
CHECKPOINT-MIB::tempertureSensorIndex.3.0 = INTEGER: 3
CHECKPOINT-MIB::tempertureSensorIndex.4.0 = INTEGER: 4
CHECKPOINT-MIB::tempertureSensorName.1.0 = STRING: CPU0 Temp
CHECKPOINT-MIB::tempertureSensorName.2.0 = STRING: CPU1 Temp
CHECKPOINT-MIB::tempertureSensorName.3.0 = STRING: Intake Temp
CHECKPOINT-MIB::tempertureSensorName.4.0 = STRING: Outlet Temp
CHECKPOINT-MIB::tempertureSensorValue.1.0 = STRING: 65.50
CHECKPOINT-MIB::tempertureSensorValue.2.0 = STRING: 65.00
CHECKPOINT-MIB::tempertureSensorValue.3.0 = STRING: 30.38
CHECKPOINT-MIB::tempertureSensorValue.4.0 = STRING: 31.50
CHECKPOINT-MIB::tempertureSensorUnit.1.0 = STRING: Celsius
CHECKPOINT-MIB::tempertureSensorUnit.2.0 = STRING: Celsius
CHECKPOINT-MIB::tempertureSensorUnit.3.0 = STRING: Celsius
CHECKPOINT-MIB::tempertureSensorUnit.4.0 = STRING: Celsius
CHECKPOINT-MIB::tempertureSensorType.1.0 = STRING: Temperature
CHECKPOINT-MIB::tempertureSensorType.2.0 = STRING: Temperature
CHECKPOINT-MIB::tempertureSensorType.3.0 = STRING: Temperature
CHECKPOINT-MIB::tempertureSensorType.4.0 = STRING: Temperature
CHECKPOINT-MIB::tempertureSensorStatus.1.0 = INTEGER: 0
CHECKPOINT-MIB::tempertureSensorStatus.2.0 = INTEGER: 0
CHECKPOINT-MIB::tempertureSensorStatus.3.0 = INTEGER: 0
CHECKPOINT-MIB::tempertureSensorStatus.4.0 = INTEGER: 0
snmpwalk -v 3 -l authNoPriv -u user -A pass vsx1 CHECKPOINT-MIB::raidDiskState
CHECKPOINT-MIB::raidDiskState.1.0 = INTEGER: 0
CHECKPOINT-MIB::raidDiskState.2.0 = INTEGER: 0
OIDs: Connections
Current connections in certain virtual system and the configured limit.
This limit is configured in the virtual system properties, Optimization section (Capacity Optimization)

| Connections | fwNumConn.0 | .1.3.6.1.4.1.2620.1.1.25.3.0 |
| Connections limit | fwConnTableLimit.0 | .1.3.6.1.4.1.2620.1.1.25.10.0 |
CHECKPOINT-MIB::fwNumConn.0 = Gauge32: 64121
snmpwalk -v 3 -l authNoPriv -u user -A pass -n ctxname_vsid2 vsx1 CHECKPOINT-MIB::fwConnTableLimit.0
CHECKPOINT-MIB::fwConnTableLimit.0 = Gauge32: 199900
OIDs: ClusterXL state
If you manage a Checkpoint ClusterXL, I suppose you use quite a lot the “cphaprob state” command.
| ClusterXLState | haState | .1.3.6.1.4.1.2620.1.5.6.0 |
CHECKPOINT-MIB::haState.0 = STRING: standby
OIDs: CPU
Monitor each of the CPUs
| CPUCores | multiProcUsage | .1.3.6.1.4.1.2620.1.6.7.5.1.5 |
CHECKPOINT-MIB::multiProcUsage.1.0 = Gauge32: 7
CHECKPOINT-MIB::multiProcUsage.2.0 = Gauge32: 2
CHECKPOINT-MIB::multiProcUsage.3.0 = Gauge32: 8
CHECKPOINT-MIB::multiProcUsage.4.0 = Gauge32: 8
CHECKPOINT-MIB::multiProcUsage.5.0 = Gauge32: 7
CHECKPOINT-MIB::multiProcUsage.6.0 = Gauge32: 7
CHECKPOINT-MIB::multiProcUsage.7.0 = Gauge32: 6
CHECKPOINT-MIB::multiProcUsage.8.0 = Gauge32: 6
CHECKPOINT-MIB::multiProcUsage.9.0 = Gauge32: 6
CHECKPOINT-MIB::multiProcUsage.10.0 = Gauge32: 6
CHECKPOINT-MIB::multiProcUsage.11.0 = Gauge32: 6
CHECKPOINT-MIB::multiProcUsage.12.0 = Gauge32: 6
CHECKPOINT-MIB::multiProcUsage.13.0 = Gauge32: 5
CHECKPOINT-MIB::multiProcUsage.14.0 = Gauge32: 5
CHECKPOINT-MIB::multiProcUsage.15.0 = Gauge32: 5
OIDs: Memory
Counters
| RAM - Real Total | memTotalReal64 | .1.3.6.1.4.1.2620.1.6.7.4.3 |
| RAM - Real Active | memActiveReal64 | .1.3.6.1.4.1.2620.1.6.7.4.4 |
| RAM - Real Free | memFreeReal64 | .1.3.6.1.4.1.2620.1.6.7.4.5 |
| RAM - Virtual Total | memTotalVirtual64 | .1.3.6.1.4.1.2620.1.6.7.4.1 |
| RAM - Virtual Active | memActiveVirtual64 | .1.3.6.1.4.1.2620.1.6.7.4.2 |
| Hmem fails | fwHmem-failed-alloc | .1.3.6.1.4.1.2620.1.1.26.1.21 |
| System Kmem fails | fwKmem-failed-alloc | .1.3.6.1.4.1.2620.1.1.26.2.15 |
Traps
| Swap memory utilization alert | chkpntSwapMemoryTrap | .1.3.6.1.4.1.2620.1.2000.4.1 |
| Real memory utilization alert | chkpntRealMemoryTrap | .1.3.6.1.4.1.2620.1.2000.4.2 |
OIDs: Memory VSX
The following SNMP queries have to be done on the VSX Host.
| RAM - Memory Usage VS ID | vsxStatusMemoryUsageVSId | .1.3.6.1.4.1.2620.1.16.22.3.1.1 |
| RAM - Memory Usage VS Name | vsxStatusMemoryUsageVSName | .1.3.6.1.4.1.2620.1.16.22.3.1.2 |
| RAM - Memory Usage per VS | vsxStatusMemoryUsage | .1.3.6.1.4.1.2620.1.16.22.3.1.3 |
SNMPv2-SMI::enterprises.2620.1.16.22.3.1.1.1.0 = INTEGER: 0
SNMPv2-SMI::enterprises.2620.1.16.22.3.1.1.2.0 = INTEGER: 1
SNMPv2-SMI::enterprises.2620.1.16.22.3.1.1.3.0 = INTEGER: 2
SNMPv2-SMI::enterprises.2620.1.16.22.3.1.1.4.0 = INTEGER: 3
SNMPv2-SMI::enterprises.2620.1.16.22.3.1.1.5.0 = INTEGER: 4
SNMPv2-SMI::enterprises.2620.1.16.22.3.1.1.6.0 = INTEGER: 5
SNMPv2-SMI::enterprises.2620.1.16.22.3.1.1.7.0 = INTEGER: 6
SNMPv2-SMI::enterprises.2620.1.16.22.3.1.2.1.0 = STRING: "fwvsx01"
SNMPv2-SMI::enterprises.2620.1.16.22.3.1.2.2.0 = STRING: "fw01"
SNMPv2-SMI::enterprises.2620.1.16.22.3.1.2.3.0 = STRING: "fw02"
SNMPv2-SMI::enterprises.2620.1.16.22.3.1.2.4.0 = STRING: "swi01"
SNMPv2-SMI::enterprises.2620.1.16.22.3.1.2.5.0 = STRING: "swi02"
SNMPv2-SMI::enterprises.2620.1.16.22.3.1.2.6.0 = STRING: "fw03"
SNMPv2-SMI::enterprises.2620.1.16.22.3.1.2.7.0 = STRING: "fw04"
SNMPv2-SMI::enterprises.2620.1.16.22.3.1.3.1.0 = Gauge32: 1995131
SNMPv2-SMI::enterprises.2620.1.16.22.3.1.3.2.0 = Gauge32: 335056
SNMPv2-SMI::enterprises.2620.1.16.22.3.1.3.3.0 = Gauge32: 1126517
SNMPv2-SMI::enterprises.2620.1.16.22.3.1.3.4.0 = Gauge32: 98547
SNMPv2-SMI::enterprises.2620.1.16.22.3.1.3.5.0 = Gauge32: 64391
SNMPv2-SMI::enterprises.2620.1.16.22.3.1.3.6.0 = Gauge32: 103978
SNMPv2-SMI::enterprises.2620.1.16.22.3.1.3.7.0 = Gauge32: 86436
Links
Thank you for this BLOG entry somoit.net:
https://somoit.net/checkpoint-fw/useful-snmp-oids-monitor-vsx
Threat Prevention API
Threat Prevention APIs
Take control of the Threat Prevention APIs powered by the largest Threat Cloud in the industry
URL Reputation – for a domain/URL returns the classification and risk in accessing the resource
File Reputation – for a file digest (md5/sha1/sha256/sha512) returns the risk in downloading the file without the need to scan it
IP Reputation - for an IP address returns it’s classification and risk in accessing a resource hosted on it
Mail Security – upload an email for scanning against malware and phishing attacks, based on award winning Sandblast engines
All APIs are RESTful, simple to use and can be integrated as part of a SOAR application, home-made application and more!
Detailed API instructions including samples in Java/Python can now be found in the GitHub repository.
Check it out here - https://github.com/CheckPointSW/reputation-service-api
Swagger UI to explore the API
https://app.swaggerhub.com/apis-docs/cp-devops-cloud/reputation-service
GAIA - Easy execute CLI commands on all gateways simultaneously
Link
Threat Prevention Cyber Attacks Dashboard Template
If you have Anti-Bot, Anti-Virus, IPS, Threat Emulation Blades active and a SmartLog License, you're maybe interested to see the following Dashboard:


Description and Download of the Template here: https://community.checkpoint.com/community/management/visibility-monitoring/blog/2018/04/04/threat-prevention-cyber-attacks-dashboard
DOS & DDOS Prevention, Mitigation
Preface
Since R80.20 DOS/DDOS Prevention changed in Check Point.
The following is a summary how you can setup and mitigate DOS & DDOS attacks.
SYN Defender since R80.20
Important changes in IPS "SYN Attack" (SYN Defender) protection for R80.20 and above
How to configure Rate Limiting rules for DoS Mitigation (R80.20 and newer)
Mitigation
How to configure Security Gateway to detect and prevent port scan
How to create and view Suspicious Activity Monitoring (SAM) Rules
Best practice
- Set "Host Scan" and "Sweep Scan" in IPS Policy to "User Alert 1".
- In Global Settings on Smartcenter at "User Alert 1" 120 seconds blocking of source ip run via script
sam_alert -t 120 -I -src
Export Syslog Messages
Export Syslog Messages
How to export syslog messages from Gaia Security Gateway to a Log Server and view them in SmartView Tracker
Syslog from LOM Interface
At the moment it seems that syslog cannot be sent from Check Point LOM Interface.
Missing feature - Global search across multiple CMA
Preface
Before R80.x in a MDM (Multi Domain Management) you could do a search where an object is used in all the CMA's.
Until now (R80.30) this feature is not included in SmartConsole anymore.
Script solution
- https://github.com/WadesWeaponShed/Global-IP-Search-MDS
- https://community.checkpoint.com/t5/API-CLI-Discussion-and-Samples/MDS-Global-search-across-CMAs-by-IP/m-p/75906
- https://community.checkpoint.com/t5/API-CLI-Discussion-and-Samples/Search-multiple-CMA/m-p/35237
The Script
#!/bin/sh

JQ=${CPDIR}/jq/jq

OBJECT_NAME=$1
DOMAINS_FILE="domains.json"
PACKAGES_FILE="packages.json"
PACKAGE_FILE="package.json"

echo 'Getting a list of domains...'
mgmt_cli -r true -d MDS show domains limit 500 --format json > $DOMAINS_FILE
if [ $? -eq 1 ]; then
  echo "Error getting list of domains. Aborting!"
  exit 1
fi

DOMAINS_NAMES=($($JQ -r ".objects[] | .name" $DOMAINS_FILE))

echo 'Searching for object '"$OBJECT_NAME"' in all domains...'
FOUND=0
OBJECT_UID=""

for DOMAIN in ${DOMAINS_NAMES[@]}
do
  echo 'Searching in domain '"$DOMAIN"'...'
  mgmt_cli -r true -d "$DOMAIN" show objects offset 0 limit 1 in.1 name in.2 "$OBJECT_NAME" --format json > $OBJECT_NAME.json
  if [ $? -ne 1 ]; then
    OBJECT_COUNT=$($JQ -r ".total" $OBJECT_NAME.json)
    if [ $OBJECT_COUNT -ne 0 ]; then
      FOUND=1
      OBJECT_UID=$($JQ -r ".objects[0].uid" $OBJECT_NAME.json)
      echo 'Found in domain '"$DOMAIN"'!!!'
      break
    fi
  fi
done

if [ $FOUND -ne 1 ]; then
  echo 'Object '"$OBJECT_NAME"' does not exist. Aborting!'
  exit 1
fi

echo 'Searching for object '"$OBJECT_NAME"' usages in all policy packages in all domains...'
for DOMAIN in ${DOMAINS_NAMES[@]}
do
  echo 'Searching in domain '"$DOMAIN"'...'
  mgmt_cli -r true -d "$DOMAIN" show packages limit 500 --format json > $PACKAGES_FILE
  if [ $? -ne 1 ]; then
    PACKAGES_NAMES=($($JQ -r ".packages[] | .name" $PACKAGES_FILE))
    for PACKAGE in ${PACKAGES_NAMES[@]}
    do
      echo 'Searching in package '"$PACKAGE"'...'
      mgmt_cli -r true -d "$DOMAIN" show-package name $PACKAGE --format json > $PACKAGE_FILE
      if [ $? -ne 1 ]; then
        ACCESS_LAYERS=($($JQ '.["access-layers"][] | .name' -r $PACKAGE_FILE))
        for LAYER in ${ACCESS_LAYERS[@]}
        do
          mgmt_cli -r true -d "$DOMAIN" show access-rulebase package "$PACKAGE" name "$LAYER" offset 0 limit 1 filter $OBJECT_UID --format json > $OBJECT_NAME.json
          if [ $? -ne 1 ]; then
            OBJECT_COUNT=$($JQ -r ".total" $OBJECT_NAME.json)
            if [ $OBJECT_COUNT -ne 0 ]; then
              echo 'The requested object is used in policy package '"$PACKAGE"
              break
            fi
          fi
        done
      fi
    done
  fi
done

echo 'Done!'Show logging using the web interface
If you need to view Logs over the Web in Check Point you can use SmartView.
Available since R80 but not enabled per default. In R80.10 it is enabled per default and you can access it with your SmartConsole Credentials.
It looks like this in the Browser:

Also see here: https://community.checkpoint.com/thread/5212-smartview-accessing-check-point-logs-from-web
Managing partition sizes via LVM manager on Gaia OS
Partition Resize
Since R77.30 lvm_manager is included in Gaia OS and can be used to resize logical volumes on the system.
Check Managing partition sizes via LVM manager on Gaia OS (sk95566) for more information.
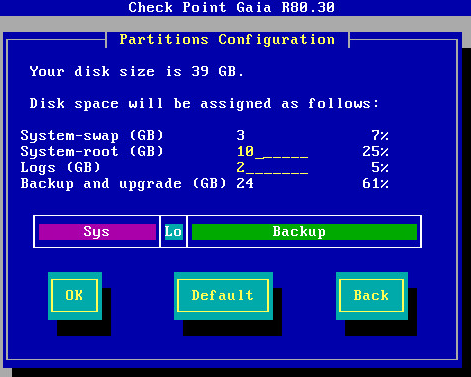
Partition Sizes when installing Gaia OS
When instaling Gaia OS there is an option to change the partition sizes.
Don't use default sizes as they are for minimal usage.
Screenshot:
Check this Link: How to configure partition sizes during Gaia installation (sk92303)
SmartConsole cli parameters
In R77.30 you could use command line parameters to specify username/password like this:
FwPolicy.exe connect %Hostname% %Username%
Since R80.10 you need to do the following:
SmartConsole.exe -p SmartConsole.LoginParams
Here is the SmartConsole.LoginParams example file:
<RemoteLaunchParemeters xmlns:xsi="http://www.w3.org/2001/XMLSchema-instance" xmlns:xsd="http://www.w3.org/2001/XMLSchema">
  <Username>admin</Username>
  <Password>password</Password>
  <ServerIP>1.2.3.4</ServerIP>
  <DomainName>LocationDomain</DomainName>
  <ReadOnly>False</ReadOnly>
  <CloudDemoMode>False</CloudDemoMode>
</RemoteLaunchParemeters>
For non-mds connection you need to leave "DomainName" field empty.
Link: https://community.checkpoint.com/thread/6432-command-line-arguments-to-r8010-smartconsoleexe
Jump to Rule Number or UID
In R80.10 you can jump directly to a rule number or a rule-UID.
With Ctrl-G you get the following:

You can copy the UID from a rule:

Or search for an rule-UID:
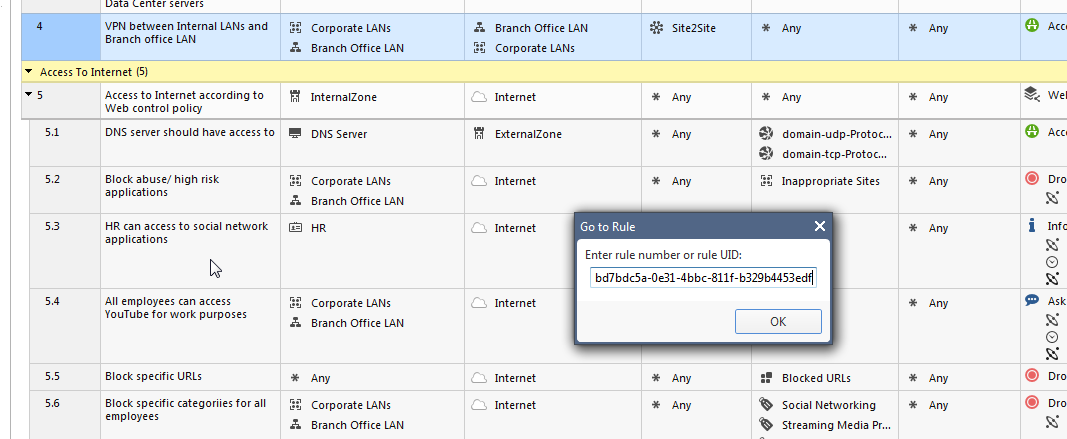
Perfect to use in documentations, just use the rule-UID or sometimes I also use the <FW_RuleName: FW_RuleName> Tag for documentation.
SmartConsole: Clear disconnected sessions
Howto clear disconnected sessions
If several SmartConsole disconnected (stale) sessions that cannot be discarded, see this here:
https://community.checkpoint.com/t5/General-Management-Topics/clear-disconnected-sessions/td-p/33027
Postgresql Queries
View
psql_client cpm postgres -c "select applicationname,objid,creator,state,numberoflocks,numberofoperations,creationtime,lastmodifytime
from worksession
where state = 'OPEN'
and (numberoflocks != '0'
or numberofoperations != '0');"
Clear
mgmt_cli discard --port 4434 uid 4b2ac7a8-9b0b-4e39-a3f0-4c065d631cdf
Username: admin
Password:
number-of-discarded-changes: 2
message: "OK"Initiating manual cluster failover
This command lets you initiate a manual cluster failover (see sk55081).
Syntax
|
Shell |
Command |
|---|---|
|
Gaia Clish |
|
|
Expert mode |
|
Example
[Expert@Member1:0]# cphaprob state

Cluster Mode:   High Availability (Active Up) with IGMP Membership

ID         Unique Address  Assigned Load   State          Name

1 (local)  11.22.33.245    100%            ACTIVE         Member1
2          11.22.33.246    0%              STANDBY        Member2


Active PNOTEs: None

... ...

[Expert@Member1:0]#

[Expert@Member1:0]# clusterXL_admin down
This command does not survive reboot. To make the change permanent, please run 'set cluster member admin down/up permanent' in clish or add '-p' at the end of the command in expert mode
Setting member to administratively down state ...
Member current state is DOWN
[Expert@Member1:0]#

[Expert@Member1:0]# cphaprob state

Cluster Mode:   High Availability (Active Up) with IGMP Membership

ID         Unique Address  Assigned Load   State          Name

1 (local)  11.22.33.245    0%              DOWN           Member1
2          11.22.33.246    100%            ACTIVE         Member2


Active PNOTEs: ADMIN

Last member state change event:
   Event Code:                 CLUS-111400
   State change:               ACTIVE -> DOWN
   Reason for state change:    ADMIN_DOWN PNOTE
   Event time:                 Sun Sep  8 19:35:06 2019

Last cluster failover event:
   Transition to new ACTIVE:   Member 1 -> Member 2
   Reason:                     ADMIN_DOWN PNOTE
   Event time:                 Sun Sep  8 19:35:06 2019

Cluster failover count:
   Failover counter:           2
   Time of counter reset:      Sun Sep  8 16:08:34 2019 (reboot)

[Expert@Member1:0]#

[Expert@Member1:0]# clusterXL_admin up
This command does not survive reboot. To make the change permanent, please run 'set cluster member admin down/up permanent' in clish or add '-p' at the end of the command in expert mode
Setting member to normal operation ...
Member current state is STANDBY
[Expert@Member1:0]#

[Expert@Member1:0]# cphaprob state

Cluster Mode:   High Availability (Active Up) with IGMP Membership

ID         Unique Address  Assigned Load   State          Name

1 (local)  11.22.33.245    0%              STANDBY        Member1
2          11.22.33.246    100%            ACTIVE         Member2


Active PNOTEs: None

Last member state change event:
   Event Code:                 CLUS-114802
   State change:               DOWN -> STANDBY
   Reason for state change:    There is already an ACTIVE member in the cluster (member 2)
   Event time:                 Sun Sep  8 19:37:03 2019

Last cluster failover event:
   Transition to new ACTIVE:   Member 1 -> Member 2
   Reason:                     ADMIN_DOWN PNOTE
   Event time:                 Sun Sep  8 19:35:06 2019

Cluster failover count:
   Failover counter:           2
   Time of counter reset:      Sun Sep  8 16:08:34 2019 (reboot)

[Expert@Member1:0]#How to migrate Custom Queries from one SmartView Tracker to another
Problem
To do administration of IPS and other modules of the check point firewall, you often need to check logs with smartlog queries.
These queries are saved then to favorites for later use.

Migration
To migrate these queries to a new user account on the same management server or to another smartview tracker you need to know where this data is stored.
The favorites queries data is stored here:
$SMARTLOGDIR/data/users_settings/<username>/Bookmarks_Custom.xml
The file Bookmarks_Custom.xml can just be copied to the location of the new user.
After a restart of the smartconsole the favorite queries are visible again.
Links
More info also here in sk39268
Check Point Log Export
Solution
Check Point "Log Exporter" is an easy and secure method for exporting Check Point logs over the syslog protocol. It is integrated in Version R80.20 or higher.
Example
Basic Log Export to another syslog Server
cp_log_export add name SyslogToSplunk target-server <ip|hostname> target-port <port> protocol tcp format splunkShow existing config
cp_log_export show

name: SyslogToSplunk
      enabled: true
      target-server: 1.2.3.4
      target-port:  8514
      protocol: tcp
      format: splunk
      read-mode: semi-unified
      export-attachment-ids: false
      export-link: false
      export-attachment-link: false
      time-in-milli: false
      export-log-position: Not configured, using default
      encrypted: true
      reconnect-interval: Not configured, using default
Filter example (Log only drop and reject messages)
cp_log_export set name SyslogToSplunk filter-action-in "drop,reject"

cp_log_export restart
Link
Troubleshooting
After policy install: UDP packet that belongs to an old session drops
Problem description
At the customer site we have a rule which allows a WLAN Controller to connect to the RADIUS Server in another network.
After installing the rules, the UDP connections were rematched because it is the needed global Setting on this Firewall.

With fw ctl zdebug drop we see the following:
;[vs_1];[tid_0];[fw4_0];fw_log_drop_ex: Packet proto=17 10.1.1.1:57056 -> 10.45.99.40:1812 dropped by fw_handle_old_conn_recovery Reason: UDP packet that belongs to an old session;
So the RADIUS Connection will not come up again.
It seems to be a virtual UDP session in the state table of the fw.
This UDP connection will never reach the timeout and will never be removed from the state table.
Troubleshooting
In the RADIUS service object "NEW-RADIUS" set "Keep connections open after the policy has been installed" but this does not help.
Problem is described here: https://www.cpug.org/forums/showthread.php/22042-ClusterXL-connection-drop-when-Policy-Push
Workaround
Disable the RADIUS server for 2 minutes and the Connections do work again.
Solution
Solution is described here:
Dropped UDP Server to Client packets refresh the connection timeout (sk121933)
Fixed in Hotfix for current installed release or future Jumbo Hotfix from CP.
How to copy a file from a Check Point firewall
For troubleshooting you need sometime to transfer files from a Check Point firewal, as example tcpdump files etc.
With the admin user it is not possible to login with sftp, the shell for the user is set to /etc/cli.sh.
For a temporary access to the sftp feature you need to change the shell of the admin or other user which is used for the filetransfer with sftp.
Change the shell of the user
[Expert@fw]# chsh username
Changing shell for username.
New shell [/etc/cli.sh]: /bin/bash
Shell changed.
Then you can do the transfer.
Change it back again if needed
[Expert@fw]# chsh username
Changing shell for username.
New shell [/bin/bash]: /etc/cli.sh
Shell changed.CPView Utility and High Load Traffic
If you have the situation and a fw has a high load on traffic sometimes you need tools to figure it out what causes the resulting high cpu load etc.
A great tool to use is Check Point's CPView:
https://community.checkpoint.com/videos/5977-the-cpview-utility
How to use CPView to get History data
Start the cpview history daemon
# cpview history on
Check the status of the history daemon
# cpview history stat
history daemon is activated
Check the history data (use <+> or <-> to scroll the time)
# cpview -t
Jump directly to timestamp
Start cpview -t for the history mode.
Then press 't' to toggle the date mode and insert the date you want to start at.
IPS Troubleshooting
IPS Profile and Detect Mode
When you run the IPS recommended profile, most of the critical and high signatures are in inactive or detect mode.
But still there could be a high cpu performance impact even when you're only in detect mode.
In prevent mode you kill the connection and you are done.
In detect mode you have to keep the connection open and keep spending CPU cycles on tracking that traffic.
So detect mode maybe is using higher cpu cycles.
R80.x Performance Tuning Tip - DDOS
R80.10 IPS Best Practices
CP_R80.10_IPS_BestPractices_Guide.pdf
Limitation of 251 Inline Layers
Problem
Policy push fails with the following error: Policy installation failed on gateway. If the problem persists contact Check Point support (Error code: 2000232)
Cause
The user has configured too many policy layers in the rulebase (a layer is either an Ordered layer or an Inline Layer).
The Security Gateway has a limitation of 251 layers (in total there are 256, while 5 are reserved).
Solution
Verify that the number of layers is not exceeding 251.
Troubleshooting
Show Access Layers
mgmt_cli show access-layers limit 500 -s id.txt --format json | jq '."access-layers"[].name'
Count Access Layers
mgmt_cli show access-layers limit 500 --format json
Output:
.
.
 } ],
 "from" : 1,
 "to" : 260,
 "total" : 260
}
See here: Show Access Layers
Packetpushers with SQLNet
If you need to apply an ALG (Application level gateway) on SQLNet be careful and check the following:
SQL*Net (a.k.a Oracle TNS) and firewalls…
Most vendor’s firewalls have a SQL ALG that handles SQL*Net traffic.
They listen on TCP port 1521.
SQL*Net is based on Oracle’s TNS protocol.
The specification for this protocol is proprietary and inaccessible, but you can figure it out by reading Oracle’s docs and looking at the Wireshark dissector source code.
In Checkpoint firewalls, there are two ALGs for SQL*Net: “sqlnet1” and “sqlnet2.”
sqlnet1 should be used for non-redirected sessions and sqlnet2 should be used for redirected sessions.
The implication is that non-redirected sessions evaluated against sqlnet2 could negatively impact the CPU of the firewall.
Show interface speed and duplex as a list
If you need a list of interfaces and the actual speed and duplex settings use this:
# ifconfig -a | grep encap | awk '{print $1}' | grep -v lo | grep -v bond | grep -v ":" \
| grep -v ^lo | xargs -I % sh -c 'ethtool %; ethtool -i %' | grep '^driver\|Speed\|Duplex\|Setting' \
| sed "s/^/ /g" | tr -d "\t" | tr -d "\n" | sed "s/Settings for/\nSettings for/g" \
| awk '{print $5 " "$7 "\t " $9 "\t" $3}' | grep -v "Unknown" | grep -v "\."
Found here: https://community.checkpoint.com/thread/7056-interface-speed-and-duplex-as-list
VPN Troubleshooting
VPN Problems
Links & Infos
IKEv2
Internet Key Exchange Protocol Version 2 (IKEv2)
https://tools.ietf.org/html/rfc5996
Check Point Probleme mit IKEv2
Site to Site using IKEv2 fails with "None of the traffic selectors match the conection"
https://support.checkpoint.com/results/sk/sk157473
How do I change the local id for an IKEv2 IPsec VPN?
https://community.checkpoint.com/t5/Remote-Access-VPN/How-do-I-change-the-local-id-for-an-IKEv2-IPsec-VPN/m-p/14786
IKEv2 negotiation for Site-to-Site VPN tunnel with 3rd party peer fails if IKEv2 SA payload contains more than 8 proposals
https://supportcenter.checkpoint.com/supportcenter/portal?eventSubmit_doGoviewsolutiondetails=&solutionid=sk112139
When Check Point peer is initiator of IKEv2 negotiation, FQDN not being sent
https://supportcenter.checkpoint.com/supportcenter/portal?eventSubmit_doGoviewsolutiondetails=&solutionid=sk108817
Debugging IKEv2 on Check Point
Link
What is the IKEView Utility ?
https://support.checkpoint.com/results/sk/sk30994
How to collect a debug for VPN issues
https://support.checkpoint.com/results/sk/sk180488
Debugging Description
- Use Ike debug to validate and understand how both devices are negotiating the parameters
disable acceleration if you can:
fwaccel off
vpn debug trunc ALL=5
ike debug trunc
ike debug on TDERROR_ALL_ALL=5
Get the file $FWDIR/log/legacy_ikev2.xmll and check the proposal for both side.
Read the file $FWDIR/log/vpnd.elg and try to find any inconsistencies.
- IKE is the same for all players, the problem is configuration. Many times, the devices try to send parameters differently of what you expect they do.
- Check Point firewalls try to summarize the networks inside the encryption domain, this is called supernetting.
It will try to summarize at maximum possible and will send that summarization in place of original one.
If you have two subnets /24 it will try to send a /23. - Route based VPN is more flexible than domain based and you can have both configured. Use it if you can.
- There's a new version for ikeview.exe capable to read $FWDIR/log/ikev2.xmll. (https://support.checkpoint.com/results/sk/sk30994)
Check on support center and if possible use its the best tool to troubleshoot VPN problems on Check Point side. - Disable debug after all
fwaccel on
vpn debug offThreat Extraction Troubleshooting
Introduction
The following is a collection of troubleshooting I need to do with Check Point Threat Extraction R80.10.
I used the Technical Reference Guide (ATRG) here: sk114807
Workflow in MTA mode
- A PostFix server receives and handles the emails.
- Emails are forwarded to the in.emaild.mta daemon, which:
- Parses the emails (For example, Base64 decode)
- Passes the attachments to the scrubd process, if needed (based on the configuration of supported file types).
- The scrubd process handles the file and sends it to the scrub_cp_file_convertd process with the relevant details (according to the policy).
- scrub_cp_file_convertd process
- Converts the file / extracts potentialy malicious content from it.
- Returns a Safe copy of the file to scrubd.
- The scrubd process returns the Safe copy to the in.emaild.mta daemon
- The in.emaild.mta daemon:
- Replaces the original attachment with the Safe Copy version.
- Forwards the email to its destination.
- Replaces the original attachment with the Safe Copy version.
Note: For environments with MTA bundle R80.10 jhf or R80.20, in.emaild.mta is replaced with mtad daemon
Check log of convert to PDF process
It seems that the path is wron documented in the sk114807
The path mentioned /var/log/jail/$FWDIR/log/scrub_cp_file_convertd.elg* is in real /var/log/jail/$CPMDIR/log/scrub_cp_file_convertd.elg*
"This notification page has expired" error in UserCheck page when a user tries to download the original file that was blocked by Threat Extraction
According to: sk106249
Symptoms
"This notification page has expired. You can safely close the page or" error in UserCheck page when a user tries to download the original attachment 7 days after receiving the original e-mail, although the Threat Extraction is configured to keep the original attachments for more than 7 days.

- Attachment file still exists in /var/log/scrub/repository/ on Threat Extraction Gateway.
- The original mail can be retrieved by running the following command on the Security Gateway: scrub send_orig_email <email_id or reference_number> all.
- The Email ID or reference number can be retrieved from the incident log.
Solution
For more information about the sk106249 you need to login to CP support portal. There you will need to check more files if you have set the "Delete stored original files older than" to 30+ days.
These files ave been patched if you have installed the latest R80.10 Jumbo hotfixes.
The next SK mentioned is the following:
Persistence of UserCheck incidents is not preserved when quarantine time is very high
sk122099
The solution for the SK above is to upgrade to R80.20
Links & Tools
Check Point Links & Tools
Blogs
- https://yurisk.info/category/checkpoint-ngngx.html
- https://checkpoint.engineer/
- https://checkpointengineer.com/
Architecture
- Ports Used for Communication by Various Check Point Modules
- R80.x Security Gateway Architecture (Logical Packet Flow)
Operating
- Domain Objects (FQDN) - deep dive
- GAIA REST-API
Troubleshooting
Tools
CLI
- Top Check Point CLI commands
- Common Check Point Commands (ccc) - Bash Script with all useful commands about check point
- fw ctl zdebug commands
- fw monitor cheat sheet